-->

Tuesday, January 17, 2017

Why is Excel changing the number I type in?

Just the other day, I opened up Excel and started typing in some numbers to add up.

18546
2523485
36500

Then I looked at my screen, and Excel is showing this:


What's up with that? It looked like my numbers were getting divided by 100. Then I realized it was adding a decimal to the last two digits, like using a ten-key!

I quickly found the answer, which lies in Excel's advanced settings.

Go to File > Options > Advanced

Uncheck the box "Automatically insert a decimal point", and you're done!


Boom!

Tuesday, November 1, 2016

If This Then That

        IF                    THEN


Have you ever found yourself doing something that you feel like someone or something else should be doing for you and go "damn, I really wish my computer would do this for me!"? Well me too. And so did the folks who made If This Then That (IFTTT for short).

IFTTT is a very cool website that allows you to create custom "recipes" to basically automate things for you without you having to learn any programming languages. The way it works is you connect your existing accounts or sign up for new accounts for things they call "channels", like Gmail, Google Calendar, Nest, FitBit, Craigslist, Twitter... basically any software or smart device that they've hooked up with (there are currently 366 different channels, and they're adding more all the time), and you can create a "recipe" that will do something for you when something happens. They have tons of pre-made recipes up there already you can start with. If you create your own recipe, you can publish it!

Here are some examples:

Text me when a VIP sends me an email
IF my gmail receives an email from a specific sender
THEN send me a text message to alert me about it

Farm Tractor Tweets
IF an Ebay search finds a new posting for a used tractor for sale,
THEN send a tweet about it along with a photo on twitter!

Receive an email if there will be rain in your area tomorrow
IF the weather forecast shows rain is predicted in your area,
THEN send an email to you letting you know

If the temp rises over 99F, email the president about global warming
IF the current weather goes over 99 degrees Fahrenheit,
THEN send an email to the president about global warming

There are tons of other great recipes (including some that are actually useful) so I encourage you to explore and see if you can find any that you might use.

Cheers!
Daniel

Thursday, July 21, 2016

Python!

Howdy everyone! It's been too long, sorry about that.

So I've been obsessing lately with Python, and wanted to share my newfound respect and obsession. In fact, I actually created a blog completely devoted to Python, which will focus on its use for CPAs and accountants. I haven't actually started posting on that blog yet, but I have some plans for it.

If you have never heard of Python, or are familiar with it but haven't used it much, it's awesome and I encourage checking it out. There are some great free resources online to learn from, including several great courses on Coursera. My favorite is the Rice University series.

Afraid of Python because you're not a programmer? No fear! It uses mostly plain English and simple statements. Of course it can get massively complex, and looking at new code and libraries and all of the different options for writing and using it can get daunting, but if you start small and basic, you'll quickly learn how powerful it is.

Why would you care about Python? Because it's MEGA POWERFUL.  I used to think Vlookups, Sumifs, and Pivot Tables were the next level in Excel. Visual Basic definitely is up there in the next level category in excel of data analysis and performing many calculations. BUT in the Excel world, there are limits. And there's a lot of room for errors. With something like Python, especially Pandas (more on that later, in the python blog), you can have HUGE amounts of data, and perform analysis and calcluations much more efficiently, accurately, and consistently.

I'll keep most of the Python specific things on that blog, however if there's something I add on this blog that can also be done in Python, I'll mention it on here.

Check it out!

Cheers,
Daniel


Tuesday, December 22, 2015

Tech Tip Tuesday - SUMIF, SUMIFS, and Pivot Tables, oh my!

Long time no see!

Hey everyone,

HAPPY TUESDAY!!!!!!

I wanted to share some useful ways to add cells in excel that can increase efficiency in any kind of analysis or summing type situation.

I’m providing this example for demonstration purposes, but you can apply these techniques to a number of different scenarios in excel. The SUMIF and SUMIFS formulas can be used with more types of data than a Pivot Table, however if the data’s in the right format, Pivot Tables are much more versatile and powerful than the SUMIF and SUMIFS formulas.

Example: take a list of numbers that we want to summarize in a certain way. Here I have a list of names, dates, numbers, and type of animal. Let’s say this is a list of how many cats or dogs each person adopted on each day.


Now, if we want to add up the total number of cats and total number of dogs that Sally adopted during this time period, there are a few ways we can do this:

Five Different ways to add:

1.       Ten-key / adding in the cell
2.       Using an Equals and Plus cell reference formula
3.       Adding a flag and using a Sumif formula
4.       Using a Sumifs formula
5.       Using a pivot table

Breakdown:

Ten-key:

a.       How: use the ten-key on your desk, a calculator app on your computer, or add within the cell (6+5+1+8 = 20)
b.      Analysis: While this is a reliable and tried & true method, it’s arguably the least efficient, especially when you start getting past 50 items or so (depending on how speedy you are with the ten-key)

Equals and Plus formula.

a.       How: use a formula in another cell. In the above example, the formula for Sally’s Cats would be “=C11+C17+C19+C29”
b.      Analysis: While this seems easy, it’s still a lot of manual work, and almost as inefficient as using the ten-key. Also if you miss one, it’s not very easy to tell which cells you might have missed, again especially if you have over 50 rows of data. Also this one is a little too “clicky typey” for me.

Flag and a Sumif formula:

a.       How: Add a “flag” such as a number or character in the row to the right of the numbers you want to add. For example, see below:
§  The SUMIF formula has three parts*: (range, criteria, [sum range])
§  The “range” tells the formula which cells to look for the matching criteria.
§  The “criteria” tells the formula what to look for within the range.
§  The “sum range” is the range we want to add if the “range” cell in the same row meets the “criteria”
§  Next add this formula in the resulting cell to calculate the Sally Cat sum: =SUMIF(E:E,”1”,C:C)

* Excel expert note: The “sum range” is optional. If left out, the “range” becomes the “sum range”. But I usually specify the “sum range”, as my “range” usually is not the same column as my “sum range”. Leaving the “range” as the “sum range” is useful if you do a sumif that includes a formula criteria on numbers that you also want to sum. For example you could SumIf a list of numbers on only those numbers that are greater than 5.

b.      Analysis: SUMIF can be much more efficient than the previous two methods. But it can be even more helpful in that if you add the formula before adding the flags, you can watch the formula balance increase or decrease as you add or remove flags from the different rows. Try it out! The downside is there’s still a manual element to this, which involves going in and adding the ‘1’s and ‘2’s next to every row you want to include.
c.       Additional note: The second part of the formula, the “criteria”, can reference a cell that contains the specified criteria instead of hardcoding the criteria. For example, see below to easily add up the Sally Cat and Sally Dog amounts using this formula in I3: =SUMIF(E:E,H2,C:C) and this formula in I4: =SUMIF(E:E,H3,C:C)

Here’s with the formulas showing:

As you can see, SUMIF with reference to a cell for criteria is very useful because you can add additional flags all day long, and just copy and paste your SUMIF formula.


SUMIFS formula:

a.       How: The SUMIFS formula will only work if you have reliable and consistent data, in the exact same format throughout the data. If you do, this is a fantastic way to add numbers using multiple criteria. The two criteria we are using here are Name (Sally) and Type (either Dog or Cat).
·   This one gets a little more complex, but I promise it is easier once you understand how it works.
·   The SUMIFS formula, like the SUMIF formula, involves RANGE, CRITERIA, and SUM RANGE. However with the SUMIFS, you can have MORE THAN ONE criteria. It’s organized as follows: (sum range, criteria range1, criteria1, [criteria range 2, criteria 2], etc……)
·   Given our Sally Cat calculation, we’d use the following formula: =SUMIFS(C:C, D:D,"Cat",A:A, "Sally")
·   And yes, you guessed it, to add up the Sally Dogs just replace the word “Cat” with the word “Dog”
Here’s with the formulas
·   And again, you can use formulas to reference the cells containing “Cat”, “Dog”, and “Sally”:
·   (Note the Dollar sign ‘$’ in the formula: This is used to keep the ‘H’ and the ‘2’ the same even when the formula is copied and pasted to different rows or columns)
·   (Fun tip: CTRL+~ is a shortcut to show all formulas in excel. Press it again to hide formulas.)
b.      Analysis: If data is in a consistent format, this is great way to do multi-conditional sumifs. I used to use these quite a lot, however I graduated to pivot tables a few years ago...

Pivot Tables

a.       How: There are several things you must do before creating a pivot table:
·   First, make sure your data is correctly formatted. No blank columns, no blank rows, and all columns must have a label, preferably unique. The example above is almost ready to go, except it has no header for the Names, therefore we must add a header (I used “Name” in cell A1)
·   Next select the data you want to include in the pivot table. In our example, it’s A1:D29.  You can select it by pressing CTRL+A anywhere within the data, just look to make sure it correctly highlighted what you want. Here’s what it should look like:
·   Now go to INSERT > Pivot Table
·   Make sure the correct Table/Range is selected, and the New Worksheet is selected, then hit OK.
·   Now we have a Pivot Table, but note nothing shows up until we tell excel what data goes where:
·   Definitions:
1.       Here’s where the pivot table results will go
2.       These are the columns, or Fields, that we pulled into the pivot table data. To create the pivot table, we must pull several of these Fields into one of the four areas in the bottom right quadrant. Typically you at least will want to have ROWS and VALUES.
3.       Filters are used to filter the results.
4.       Columns take the data in whatever PivotTable Filed you want to display as columns. Easier to understand this one when  you see it in action
5.       Rows are my favorite. These are used to setup what we will summarize results on later, and we will use the RANGE from the SUMIF formula for the rows
6.       Values take the Field input, and summarize or count based on the ROWS and COLUMNS that match. Again this makes more sense when you see it, but I’ll show how we can create a pivot table that gives us exactly what we created using the sumifs formula.
·   Setting up the pivot table to mimic the SUMIFS (to move, click and drag the fields from the top area to the bottom quadrant):
1.       Put Name in ROWS
2.       Type goes in COLUMNS
3.       Number goes in VALUES (make sure it is “SUM” rather than “COUNT”)
4.       Date is not important to us at this point so we will not use it.
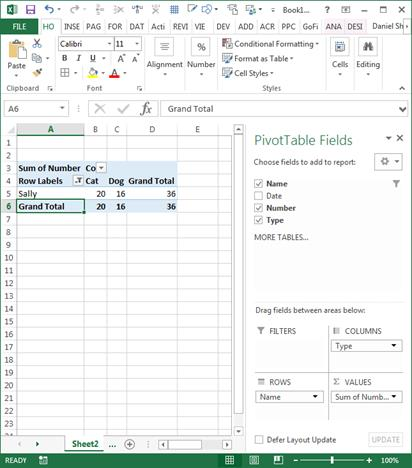
·   Note how easily we can now see the total cats and dogs for each person!
·   Now if we want to just see Sally’s you can filter using the dropdown arrow next to “Row Labels”, uncheck “select all”, and check Sally.

Click “OK” and BOOM!


b.      Analysis: In my opinion, pivot tables are clearly the best here, as they provide a very versatile and easy to use format. The data can be literally “pivoted” in different directions, filtered in different ways, with ease.

Cheers!
Daniel

Tuesday, May 19, 2015

Adobe Split Window!

Happy Tuesday!


I re-discovered something really useful about Adobe yesterday. If you are looking at one PDF file and are finding yourself flipping back and forth between different parts of the file over and over (e.g. if you are comparing contents from one page to the contents of another page), there is a very useful feature that allows you to see two parts of the same document at the same time.

Just click and drag down this little bar on the top right of your document, and it will split the screen!

In this example. I’m looking at the US Government’s 2014 Financial Statements, and want to read the notes to the financial statements that relate to the specific liabilities line item of Federal debt securities held by the public and accrued interest (Note 12).

Once you’ve split the screens, you can independently zoom in and out, and scroll up and down in each of the two parts of the window.


And now here’s how it looks dragged down. Note I have zoomed in on the top part, and zoomed down and scrolled to the Notes in the bottom part.


If you want to scroll up or down in either section, simply hover your mouse over that part of the window and use the mouse scroll wheel. No need to click on it first.

Enjoy!


Friday, October 31, 2014

Beware of CSV files!


If you work with excel files a lot, chances are you’ve had this experience. You start working on an excel file, working hard on formatting, adding and editing formulas, highlighting, creating pivot tables and extra tabs, and as soon as you save or email the file, you realize all your hard work was lost! Lo and behold, what you thought was an excel file may have been a CSV (Comma Separated Values) file.
 
CSV files are very useful, in that they can take a large amount of data and store it in a much smaller amount of space than if you were saving excel. You’ll see lots of different reporting and data software that exports reports and files into CSV format. The sneaky thing is when you open these in excel, they look just like an excel file, and excel even lets you format, add formulas, and add tabs – but when you go and attach the file to an email or save it, all of those formatting changes, formulas, and extra tabs go away! So make sure to save the file as an xls or xlsx file before saving or emailing.

Cheers!

Friday, June 20, 2014

Tech Tip - Powerpoint Slide Numbers Aren't Showing!


Have you ever tried adding a slide number into PowerPoint slides, but you can’t get the slide numbers to show up? That happened to me today, and I found a useful blog post here which I’ve conveniently re-posted in this post. The trick works! But the trick for me was I had to select all of the master slides and check the “footnote” box.

When the Slide Number Doesn’t Show in PowerPoint

If you’re working in PowerPoint, and you want the slide number to display on the slide, the process is generally simple:
  1. Go to the Insert tab.
  2. Click the Slide Number button.
  3. On the Slide tab, check the Slide Number box.
  4. Click Apply to All to make the slide number show on all slides, or Apply to make the slide number show on just the current slide.
But what do you do if you follow the process above and the slide number still doesn’t appear on the slide?

Check to make sure your slide master has a slide number placeholder.

The slide master is the template for the entire presentation. If the slide number placeholder does not appear on your slide master, then it will not appear on your slide, even if you try to insert it through the process above.
1.  Check to see if the placeholder appears on your slide master.
  1. Go to the View tab.
  2. Click on the Slide Master button.
  3. Click on the outdented slide in the panel on the left. It should have a 1. next to it.
  4. Look at the slide in the enlarged view on the right and see if it has a box along the bottom (or anywhere, really), that has a # sign in it. This is the slide number placeholder (circled below).

2.  Add the slide number placeholder, if you do not see it.
  1. Go to the Slide Master tab.
  2. Click on the Master Layout button.
  3. Check the box next to Slide Number
  4. Click OK.


3.  Check the indented slide masters for each individual slide layout.
In the left pane of the Slide Master view, you’ll see a different slide representing each possible layout. See the screenshot to the right for examples. You’ll need to check each individual layout slide master to see that the slide number placeholder is visible in that layout (assuming you want to see a slide number when you use that layout).
  1. Click on one of the individual slide layout masters. If the slide number placeholder appears, check the next individual slide layout master. If not, continue reading.
  2. Go to the Slide Master tab on the ribbon.
  3. Check the Footers box in the Master Layout section of the ribbon. The slide number placeholder should appear.
  4. Repeat for each layout on which a slide number should show.
4.  Add slide numbers to your slides.
When you are finished working with the slide master, click the Close Master View button on the Slide Master tab of the ribbon so you can continue to edit your presentation. Then follow the instructions at the top of this post to insert slide numbers on your slides.

Is your slide number covered by a shape or other object?

If you’ve inserted slide numbers, you’ve checked that your slide master has a slide number placeholder, and you still cannot see slide numbers on your slides, check to make sure there is not an object on your slide covering up the slide number.
To see all objects on the slide click once on your slide and the press Ctrl + A on the keyboard. This will select all objects on the slide, even the ones you might not see because they are the same color as the background. See if there is something in the bottom right corner of the slide, where the slide number usually appears, that might be covering it. If so, deselect the objects by clicking once in the grey area outside your slide, then select the covering object by clicking where you saw it on the slide. Either delete it, by pressing the Backspace key on the keyboard, or move it by clicking and dragging the object.
Didn’t find anything? Check again on the slide master (View tab > Slide Master button). Be sure to click Close Master View when you’re finished working in the slide master.

Do you have more than one slide master?

It is possible that your slides use multiple slide masters. This happens when additional slide masters are created. It can also happen if you paste slides that use a different slide master from another presentation into your presentation.
To see if your presentation is using multiple slide masters, go back to the slide master (View tab > Slide Master button). In the left pane, scroll down and see if you have more than one set of slide masters (each set will be numbered). Either determine which slide master your presentation uses and add the slide number placeholder to that master and each layout, or add the slide number placeholder to every slide master and every layout. You can determine which presentation slides use which slide masters by hovering over the slide master.  A pop-up note appears telling you the name of the slide master and which presentation slides use it.  The screenshot below indicates that the Office Theme Slide Master is used by slide 1 of my presentation. Be sure to click Close Master View when you’re finished working in the slide master.


Enjoy!